NodeWorx Home
The NodeWorx Home page allows Server Administrators the ability to easily see the status of various services, up-to-date server graphs, server set up information, and disk usage.
Service Status
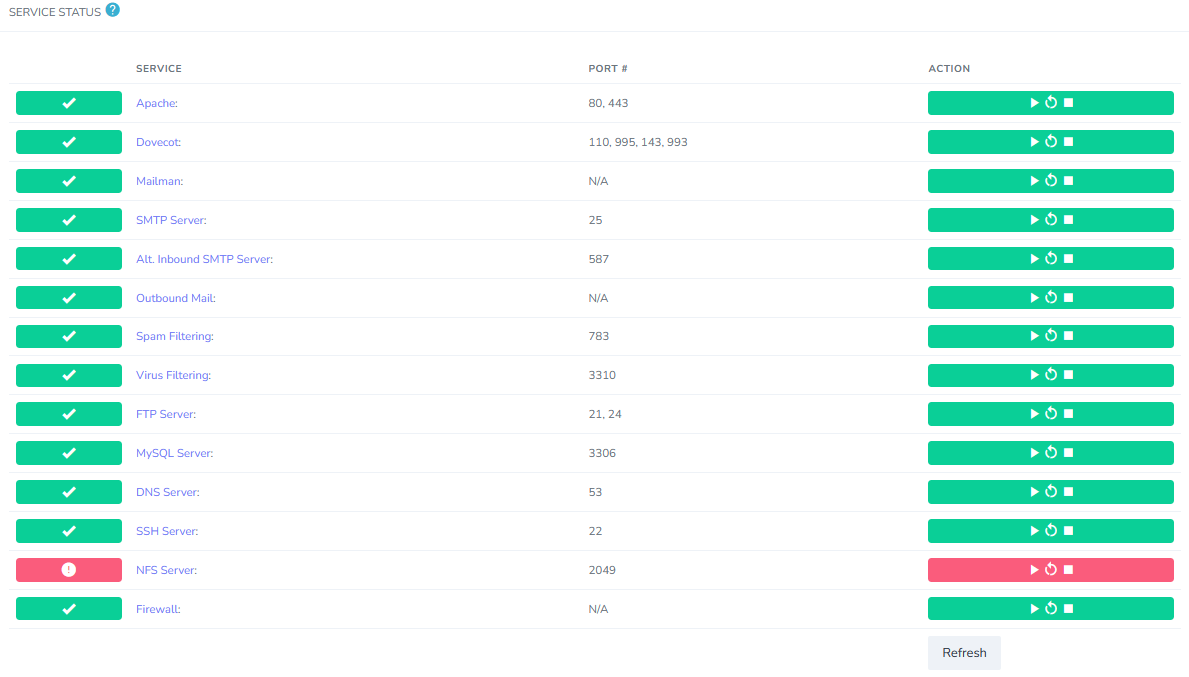
This interface shows the status of various services that InterWorx manages. It lists the service name, the port it is associated with, and an action toolbar that allows the user to stop, start, and restart the individual service.
List of Services:
Server at a Glance
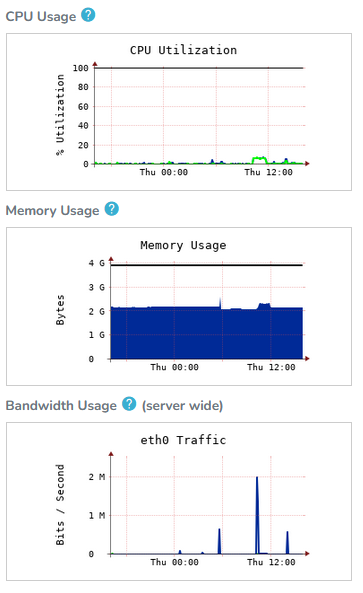
This section provides three real-time server-level usage graphs:
CPU Usage
Memory Usage
Bandwidth Usage
More detailed system graph information can be found in NodeWorx, under Server > System Graphs.
Server Info
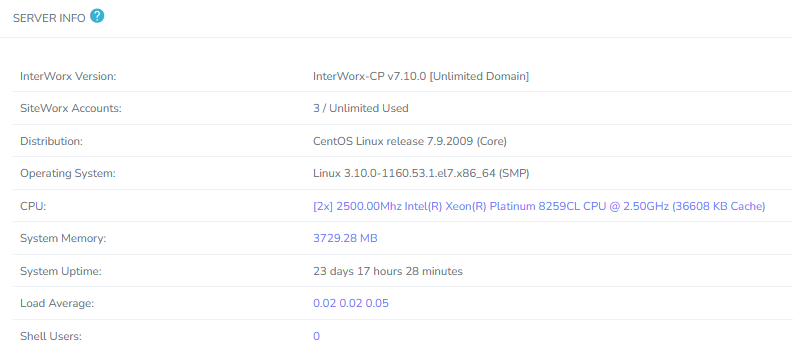
The Server Info section provides information regarding the current server configuration, and various OS/system settings. This includes:
InterWorx version
Number of SiteWorx Accounts
Linux Distribution
Kernel
CPU Specs
System Memory
System Uptime
Load Average
Number of Shell Users
Disk Usage
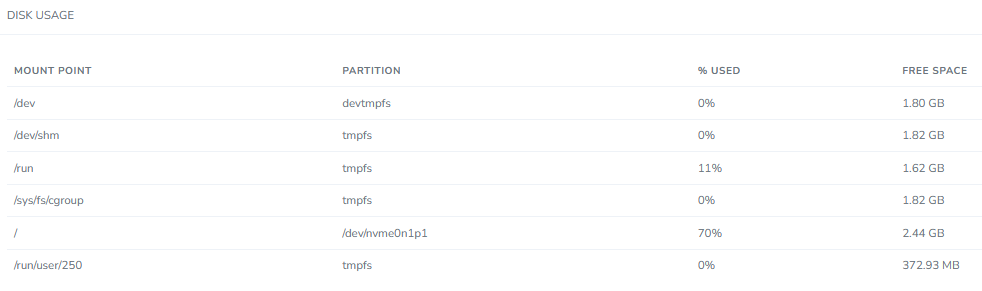
The Disk Usage section is an easy way to, at a glance, check the storage usage of all of the mounted drives.