How To: View System Resource Graphs
InterWorx provides the ability for Server Administrators to view graphical resource data for certain services at a glance.
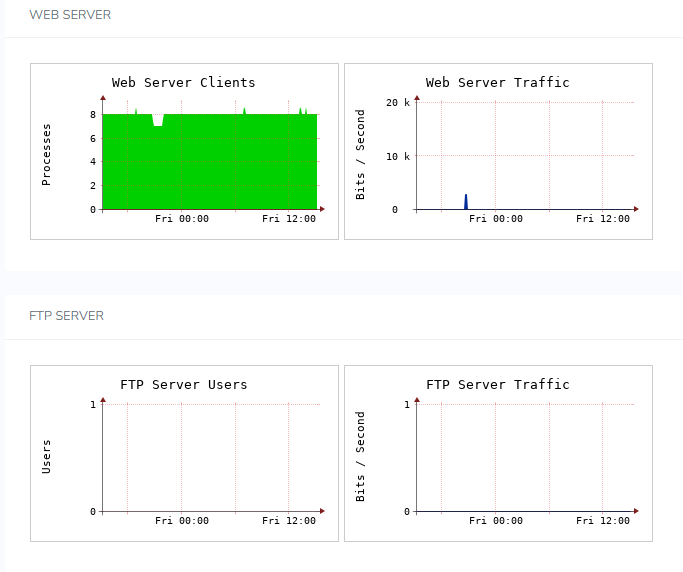
The System Graphs page in NodeWorx provides useful graph data of the following system services:
Web server
FTP server
MySQL server
Mail server
System-level resources
Network resources
Contents
To View All Resource Graphs
Log into NodeWorx from the browser (https://ip.ad.dr.ess:2443/nodeworx)
From NodeWorx, navigate to Server > System Graphs. This opens the System Graphs page
To View a Specific Resource Graph
Log into NodeWorx from the browser (https://ip.ad.dr.ess:2443/nodeworx)
From NodeWorx, navigate to Server > System Graphs. This opens the System Graphs page
Hover the mouse curser over the top left corner of the desired graph

Click the magnifying glass icon. This opens a larger view of the graph

Click the X in the upper left corner of the image to close the zoom window
To View History of a Specific Graph
Log into NodeWorx from the browser (https://ip.ad.dr.ess:2443/nodeworx)
From NodeWorx, navigate to Server > System Graphs. This opens the System Graphs page
Hover the mouse curser over the top left corner of the desired graph

Click the bar chart icon. This opens the History page for that specific graph. This page displays the following views:
Daily
Weekly
Monthly
Yearly
