How To: Manage System Health Alerts
InterWorx has several built in System Monitors to check for various issues that a server may run into, such as full partitions, expired SSL certificates for system services, yum updates failing, mail queue size growing too large, etc.
The System Health page allows Server Administrators the ability to configure System Monitor alerts, and see the status of the System Monitors at a glance.
Contents
To Check the Status of a System Monitor
Log into NodeWorx from the browser (https://ip.ad.dr.ess:2443/nodeworx)
From NodeWorx, navigate to Server > System Health
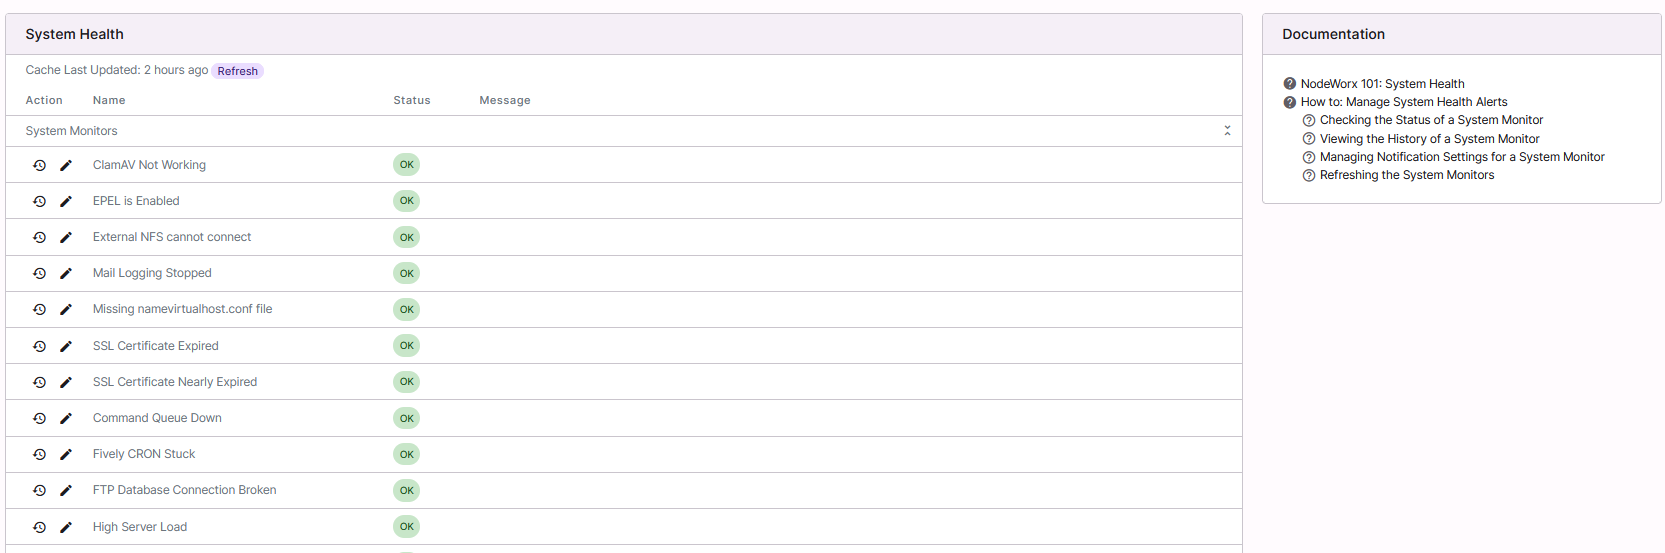
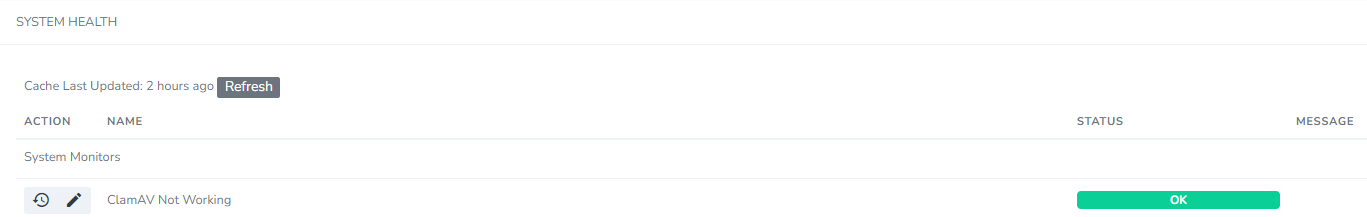
The status of each System Monitor is listed under the Status column:
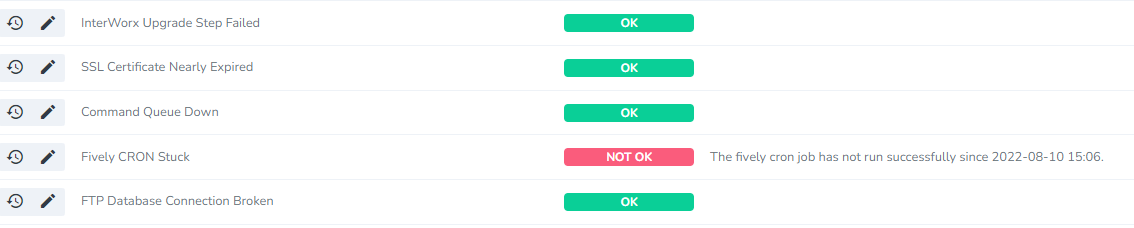
If the status is green and says OK, no issues have been detected
If the status is pink and says Not OK, an issue has been detected. Details will be shown in the Message column
To See the History of a System Monitor
Log into NodeWorx from the browser (https://ip.ad.dr.ess:2443/nodeworx)
From NodeWorx, navigate to Server > System Health
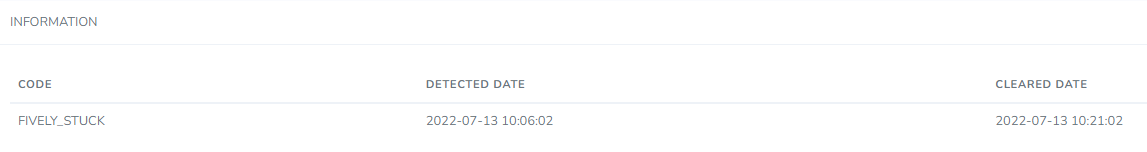
Next to the desired System Monitor, click the Clock. This opens the Information page for the System Monitor

The information page provides:
The error code
The timestamp of when the issue was detected
The timestamp of when the issue as cleared (if applicable)
To Manage Notification Settings for a System Monitor
Log into NodeWorx from the browser (https://ip.ad.dr.ess:2443/nodeworx)
From NodeWorx, navigate to Server > System Health
Next to the desired System Monitor, click the Pencil. This opens the Configuration page

Update the desired Settings information:
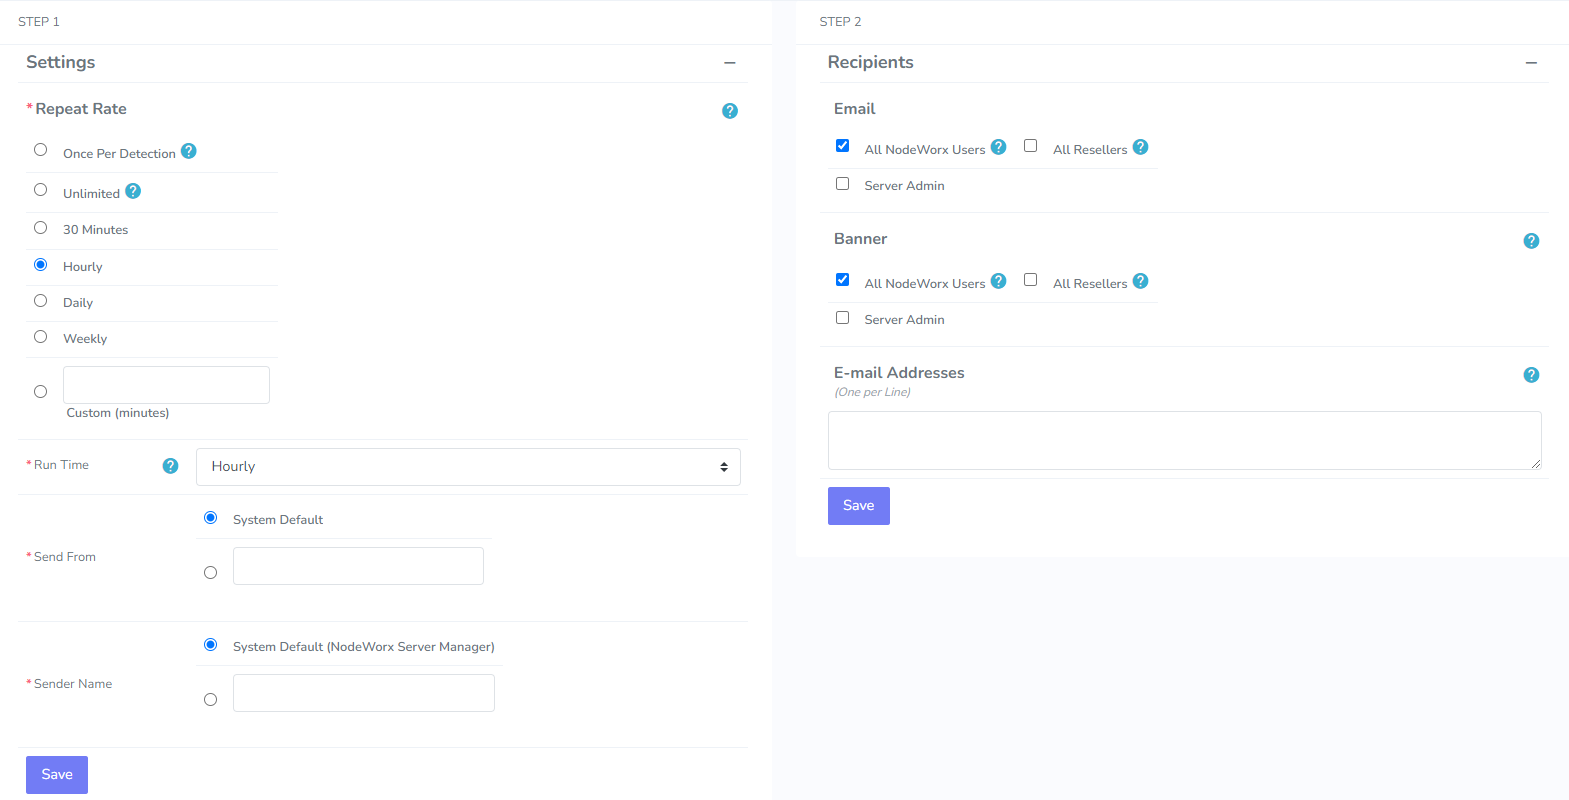
Notification Repeat Rate: How often notifications will be sent if an issue is flagged
Run Time: Controls how often the Detector is run once an issue is flagged. Detection is triggered by the InterWorx cron jobs
Send From: The email address the notification should be sent from
Sender Name: The name that should be listed as the sender
Click Save
Update the desired Recipients information:
Email: User group that notifications should be sent to
Banner: Banner notices are delivered through the InterWorx interface as a banner across the top of each screen
Email Addresses: Any additional direct emails the notification should be sent to
Click Save
To Refresh and Re-run the System Monitors
The information on the System Health page is updated every six hours by the quad-daily InterWorx cron job. Because of this, an issue that was flagged, and then resolved may still show as Not OK on the page. It is recommended to refresh this information as part of any troubleshooting steps that may be taken, and before submitting a ticket to support.interworx.com, if that is required, to make sure that the issue is still actually occurring.
Log into NodeWorx from the browser (https://ip.ad.dr.ess:2443/nodeworx)
From NodeWorx, navigate to Server > System Health
At the top of the page, click the Refresh button. This will re-run the System Monitors, to show the most up to date information on the page